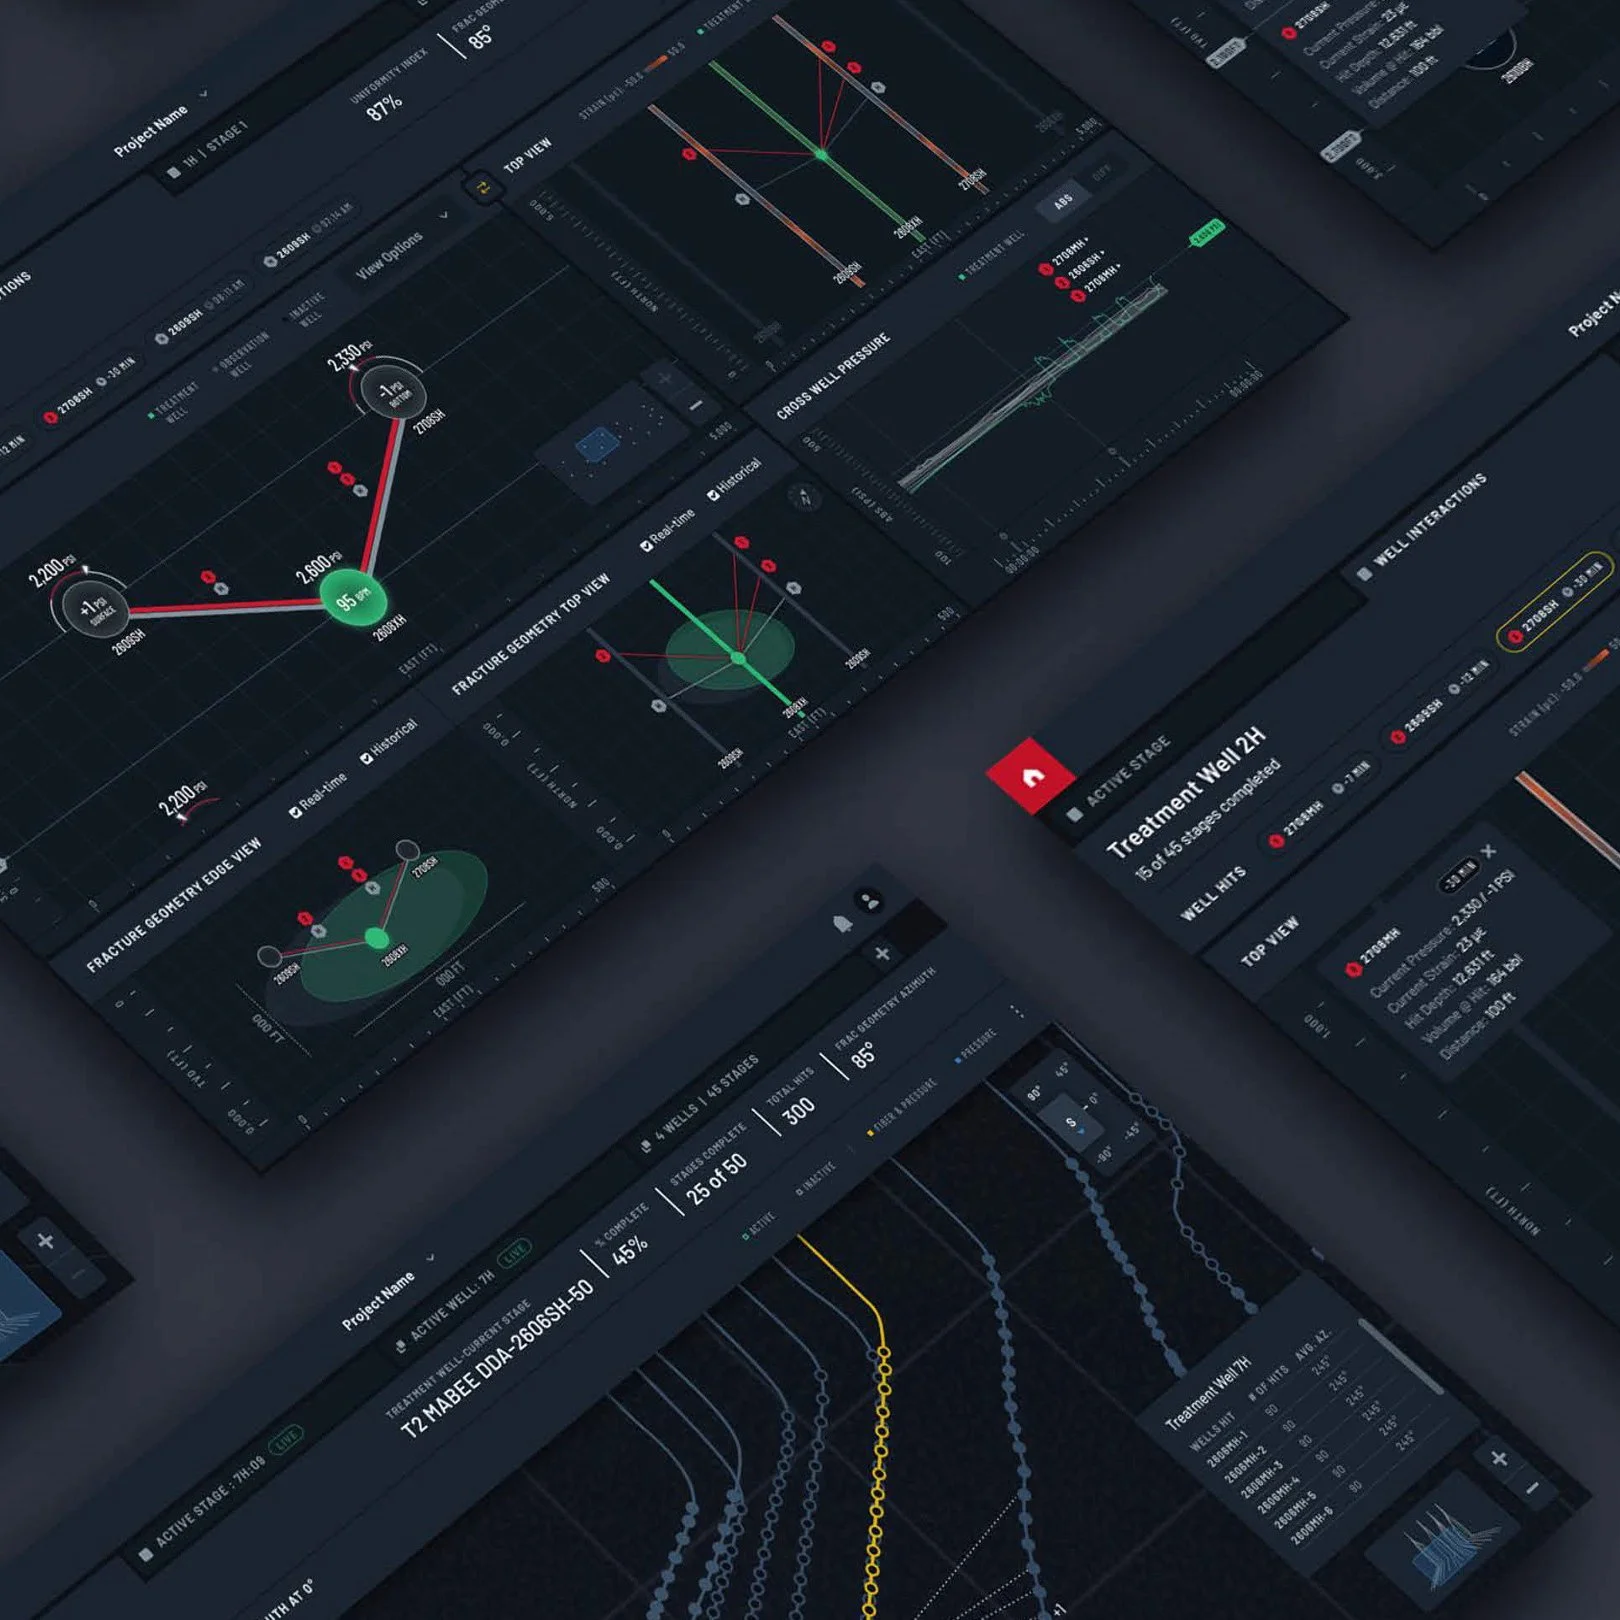
Halliburton:
the future of well interaction analytics
Pilot intelligent well interaction analytics to improve safety and efficiency
company
Halliburton
role
Design director · Design notes writer · Pinch-hitter as lead IDX & UX designer
my deliverables
Managed 8-week design sprint · Primary client engineer contact · Conducted daily team standup meetings · Pinch hit for original IXD/UX designer · Ran weekly client review meeting
agency
frog design (Capgemini Invent)
Challenge
Our team was tasked to define, design, and test the integration of intelligent real-time and predictive well interaction analytics between well bores as a feature to a new generation of Hydraulic Fracturing Analytics Software
Focus on real-time and predicted well interactions analysis and visualizations to provide critical, real-time metrics to customers while fracturing
Team
A “Make Your Mark” Moment
First frog all-female design team
Further extended an initial Design System frog created in Halliburton’s program
Fully bootstrapped remote process between San Francisco, Austin, New York City, Mexico City
Group Design Director, Design Director (+ IXD & UX), UI Designer, Project Manager

Approach: Co-creating flexible interaction models
Starting with a rapid immersion into the energy industry, the team dug into the wealth of information from the six previous projects with Halliburton, in addition to stakeholder interviews and desktop research. We held collaborative online white boarding sessions to quickly translate learnings into initial foundational designs and interaction models. We presented three IXD models to the Halliburton team.
Chosen model: an integration of all three IXD model concepts
The Halliburton team decided on a model that integrated all three IXD models. We integrated three into one model and began iterating with informal and formal input from Halliburton.
IXD (above) and design notes by Claire Morris
In this screen, the Edge View is in the Main Plot. The pressure threshold breach indicator appears when a breach occurs and shows that there is a pressure issue, how many wells are affected, and has the functionality to expand to show more information,
When an individual well breaches the pressure threshold, two visual changes happen to that well: 1.) a yellow highlight appears around the well; and 2.) a yellow highlight appears around the well name and a yellow warning icon appears in front of the well name.
All pressure breach indicators remain until the pressure breaches are fixed and then the indicators disappear. If one individual well’s pressure is fixed, but others remain, that singular fixed well’s indicators disappear, but the other well’s indicators will persist.
UI (above) by Grace Hong
In this screen the user has selected the “On” state of the “Fracture Geometry” toggle. This “Fracture Geometry Panel” should slide in from the bottom and condense the main view plot. In the Fracture Geometry panel there are Edge and Top Views. In each of these two views both “Real Time” and “Historical” are selected by default. In this example, there are hits.
“Historical” is the average fracture geometry for the entire Treatment well bore.
The fracture geometry measurements should reflect only the real-time height and width when both are displayed.
IXD (above) and design notes by Claire Morris
The pressure threshold breach indicator is a feature created in Sprint 4. In this example, the Top View is in the Main Plot. The hand appears when a breach occurs, shows a pressure issue and how many wells are affected, and has the functionality to expand to display more information.
When an individual well breaches the pressure threshold, two visual changes happen to that well: 1.) a yellow highlight around the well, and 2.) a yellow highlight around the perfect name and a yellow warning icon from the well term.
UI (above) by Grace Hong
App pressure breach indicators remain until the pressure breaches are fixed, then the indicators disappear. If one individual well’s pressure is fixed, but others remain, that singular fixed well’s indicators disappear, but the other well’s indicators will persist.
In this instance, the pressure breaches occurred on wells with fiber/strain data, but the indicators will appear on any well that had breached the pressure threshold.
Bringing cohesion through design systems
To create consistency and facilitate speed of working and transferring work, frog leveraged the Design System we established and continue to expand in partnership with Halliburton. This enabled us to conceptualize and experiment with different design styles and fidelities across 2D and 3D interfaces, allowing us to deliver to the development implementation team in the most efficient manner possible.
Client collaboration at every step
We utilized the real-time collaboration capabilities of the best-in-class, cloud-based design tool Figma in order to closely work with, collaborate with, and receive feedback from the client team. This enabled the frog team to communicate daily about product requirements, functionality, and design progress, making sure we utilized the subject matter expertise of our clients throughout the design process.
Formal client validation sessions each Friday
I conducted Voice of Customer validation sessions during each sprint on Fridays. These were conducted with current Halliburton customers in order to pressure test design work in-progress, including validating layout, user experience, and metrics. These were also used to adjust the backlog and prioritization as recommended.
“Thank you for all the amazing work and great collaboration during the past couple of months. We appreciate all your hard work to make this happen in time.”
— Halliburton Project Lead