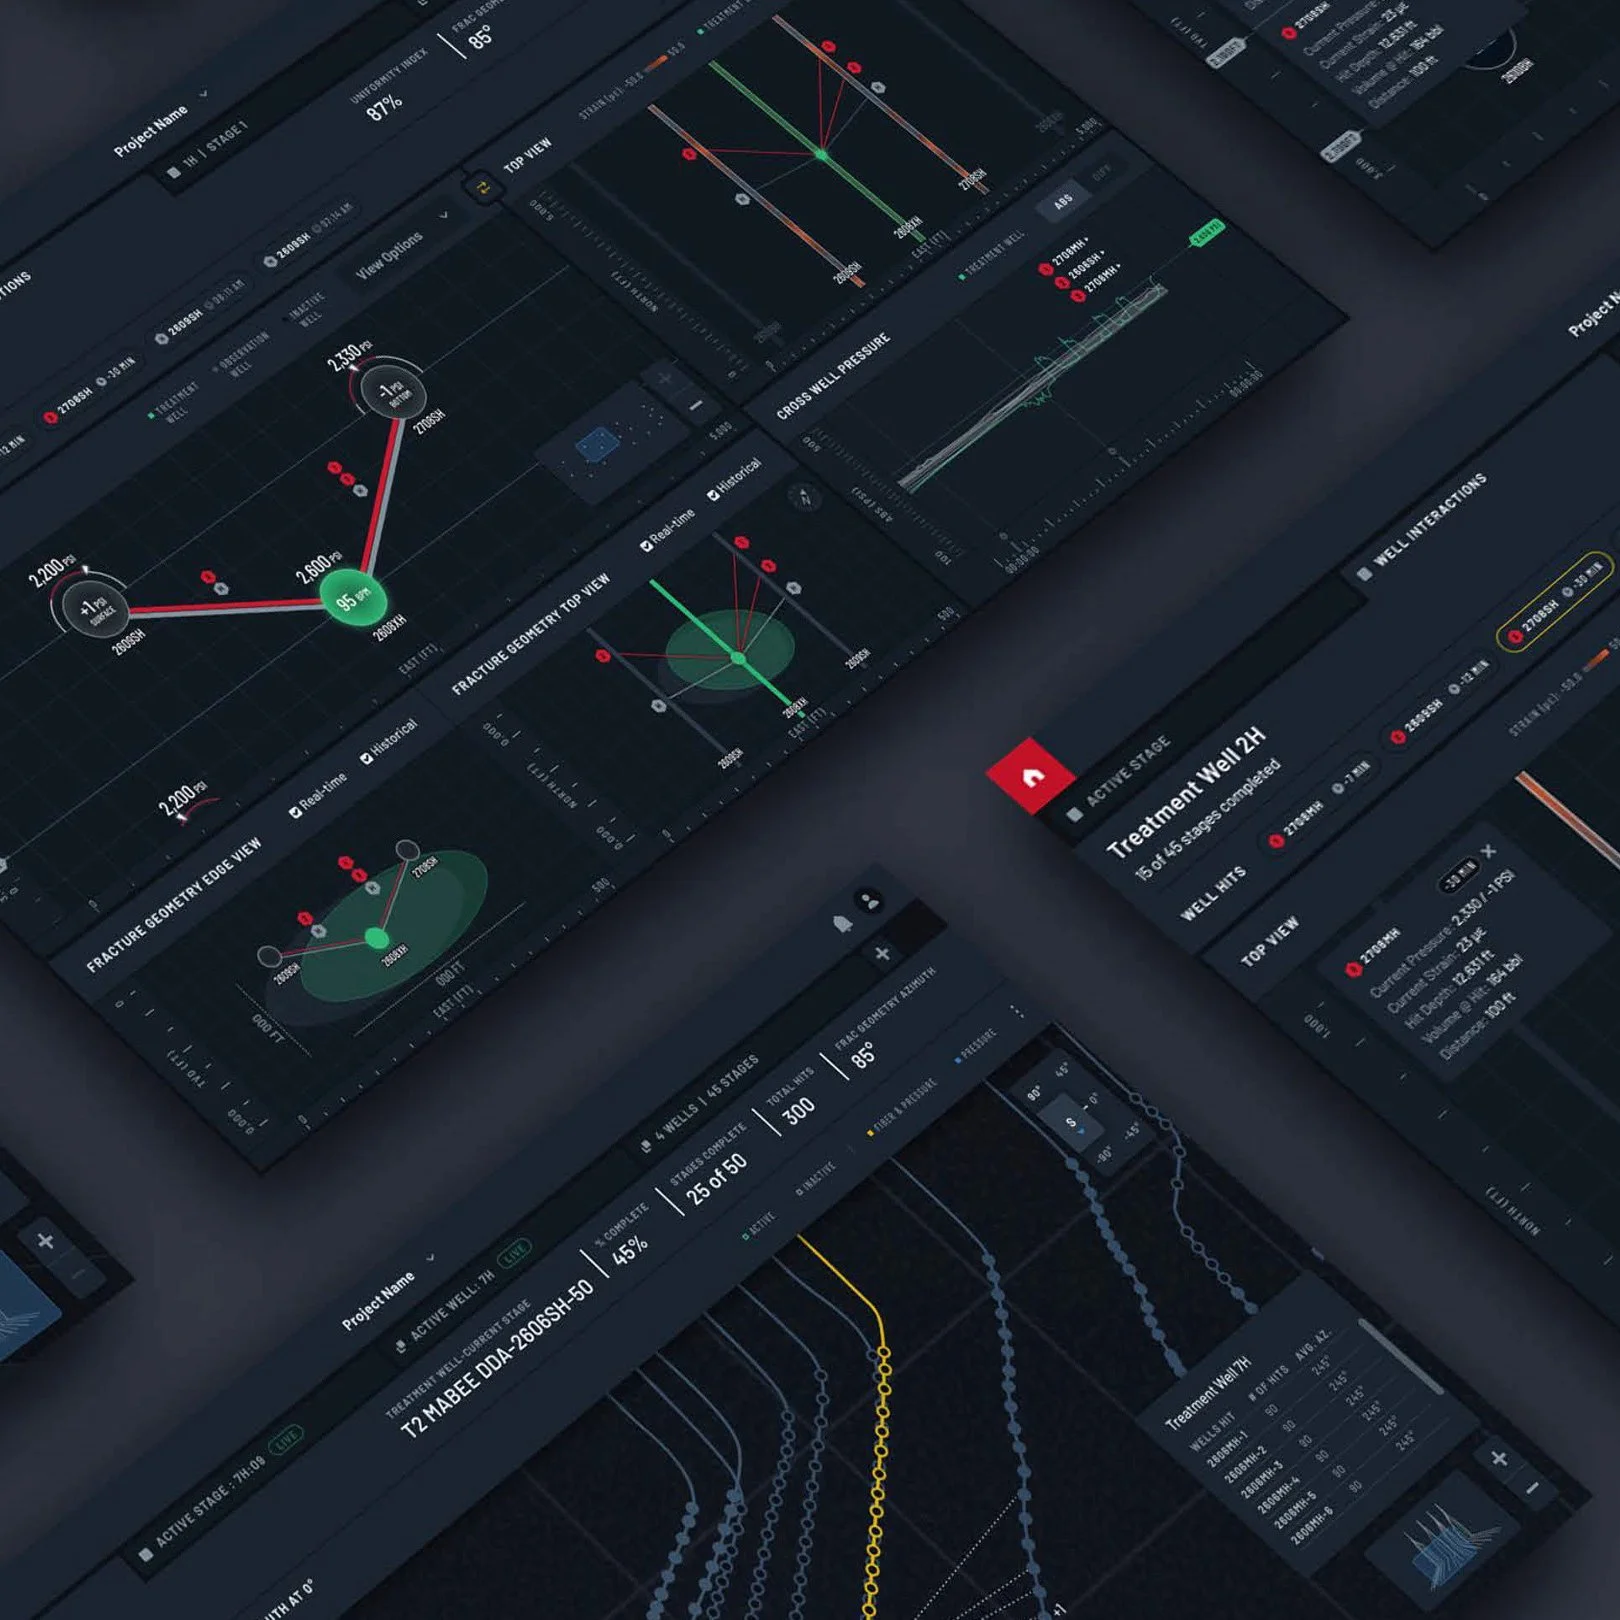
Halliburton: the future of well interaction analytics
Pilot data visualizations of intelligent well interaction analytics to improve safety and efficiency
client
Halliburton
role
Design Director — led a four-person distributed team across San Francisco, Austin, New York and Mexico City, and took the lead IXD/UX seat myself early in the sprint to hold the schedule
deliverables
Three interaction models and the integrated model chosen
Interaction design and design notes
Design system extension
2D and 3D interface designs
Voice of Customer validation findings
employment
frog, a Capgemini Invent company
Challenge
Halliburton was building a new generation of hydraulic fracturing analytics software and wanted real-time and predictive well interaction analytics — what happens between well bores during a frac — added as a feature. Our team had eight weeks to define, design and test it.
The engineering side of that problem was already solved. The data existed. The open question was whether an operator mid-frac could act on it.
Well interaction is invisible and it moves fast. A pressure breach in one well bore can mean trouble in a neighboring one, and the operator needs to know that a threshold has been crossed, how many wells are affected, and whether to intervene — in a glance, not a reading. Numbers on a dashboard don't do that. The feature only works if the interaction becomes something you can see.
Team
Group Design Director, Design Director (IXD and UX), UI Designer, Project Manager — working across four cities on a fully bootstrapped remote process, drawing on six previous frog engagements with Halliburton and extending the design system established in that program.
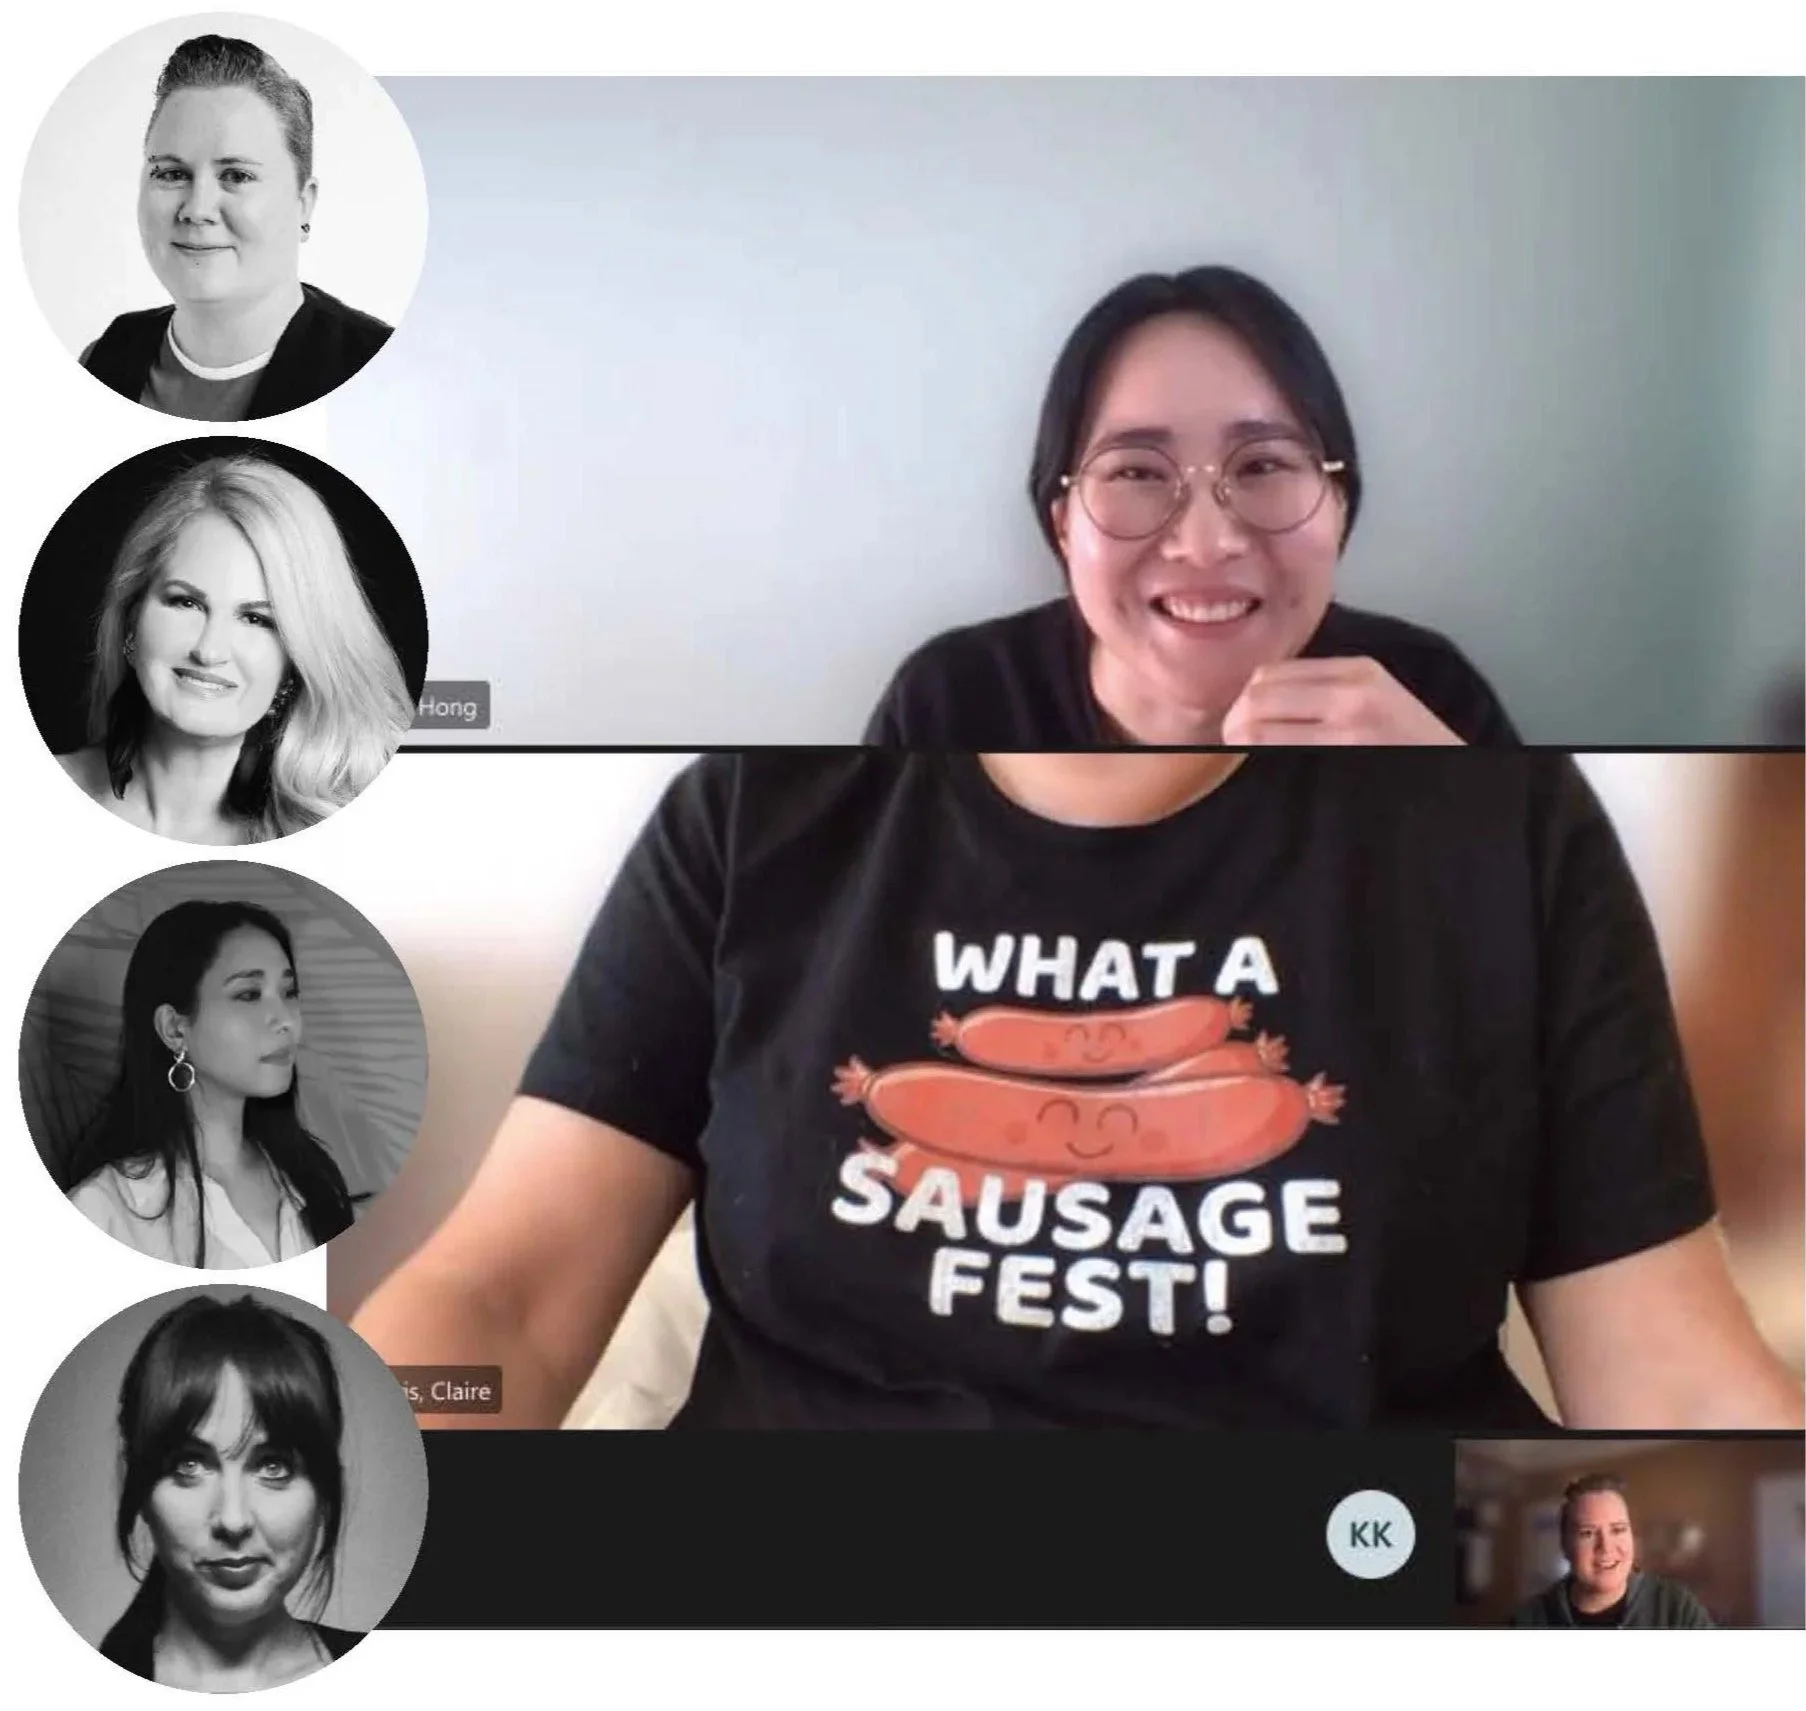
Approach: Co-creating flexible interaction models
We started with a rapid immersion into the energy industry: six previous Halliburton engagements to draw on, plus stakeholder interviews and online research. Collaborative online white boarding turned those learnings into foundational designs and initial interaction models, and we presented three to the Halliburton team.
They chose all three. Rather than pick one, Halliburton wanted the strengths of each — so we integrated the three concepts into a single model and began iterating with formal and informal input from their team.
Writing the interpretation
Four people in four cities, two companies, one feature. The risk in that setup isn’t disagreement, it’s drift. A UI designer and a client engineering team can both build faithfully from the same screen and still ship two different behaviors, because a static comp doesn’t say what happens when the state changes.
So I set the interaction direction and wrote the design notes everything was built from: the specific behavior of every indicator in every state, including the states nobody had drawn yet. That document is what kept four cities and two companies working from one interpretation.
DESIGN NOTES
Pressure threshold breach indicator
In the screen the Edge View is in the Main Plot. The pressure threshold breach indicator appears when a breach occurs. It shows that there is a pressure issue and how many wells are affected, and expands to reveal more information.
When an individual well breaches the pressure threshold, two visual changes happen to that well: a yellow highlight appears around the well, and a yellow highlight appears around the well name with a yellow warning icon in front of it.
All breach indicators remain until the pressure breaches are fixed, then disappear. If one well's pressure is fixed but others remain, that well's indicators disappear while the others persist.
In this instance the breaches occurred on wells with fiber and strain data, but the indicators appear on any well that has breached the threshold.
Fracture geometry panel
Here the user has selected the On state of the Fracture Geometry toggle. The panel slides in from the bottom and condenses the main view plot. It contains Edge and Top views, with Real Time and Historical both selected by default. In this example there are hits.
Historical is the average fracture geometry for the entire treatment well bore. When both are displayed, the fracture geometry measurements reflect only the real-time height and width.
Working method
We built on and extended the design system frog had established with Halliburton, which let us move between fidelities and across 2D and 3D interfaces without rebuilding, and hand off to the development team cleanly.
The client team worked in the file alongside us, so requirements, functionality and design progress were a daily conversation rather than a weekly reveal — their subject matter expertise was available at the moment a decision was being made, not after it.
CLIENT ACCESS TO WORKING FILES: REAL-TIME COLLABORATION
Every Friday I ran Voice of Customer validation sessions with current Halliburton customers, pressure-testing work in progress: layout, interaction, and which metrics actually mattered on screen. Those sessions fed the backlog directly. What we heard on Friday changed what we prioritized on Monday.
Meeting agenda, Interaction screens, Priorities
MEETING SET UPS (FIGMA)
Outcome
0
rounds of rework
8 weeks
concept to development handoff
7th
frog engagement with Halliburton; next one scheduled
The integrated model went into Halliburton’s product development
My design notes let the build proceed without rework
An additional engagement was scheduled for the next phase
“Thank you for all the amazing work and great collaboration during the past couple of months. We appreciate all your hard work to make this happen in time.”
— Halliburton Project Lead